StratifiedKFold in scikit-learn
우리가 보통 이진분류 같은 문제를 풀기 위해서 제공된 데이터셋을 학습/검증 셋으로 나눌 때 데이터셋의 class별 비율을 동일하게 가져가서 학습한다. 이 때, 주로 사용하는 것이 scikit-learn의 'StratifiedKFold' 함수인데 이것을 사용하면 K-fold 교차검증을 수행하면서 동시에 매 fold마다 데이터셋의 class 비율을 일정하게 나누어서 학습/검증 셋으로 나눠준다.
예를들어, '자동차, 자전거, 오토바이' class가 각각 1000개, 500개, 100개로 총 1600개로 이루어진 데이터셋을 StratifiedKFold 함수를 이용해서 5-fold로 나눈다면 매 fold마다 학습 데이터셋은 1280개 (자동차 800개, 자전거 400개, 오토바이 80개), 검증 데이터셋은 320개 (자동차 200개, 자전거 100개, 오토바이 20개)의 동일한 비율로 나눌 수 있다.
from sklearn.model_selection import StratifiedKFold

skfolds = StratifiedKFold(n_split=5, random_state=24)

fro train_idx, test_idx in skfolds.split(X_train, y_train):
	X_train_folds = X_train[train_idx]
    y_train_folds = y_train[train_idx]
    X_test_folds = X_train[test_idx]
    y_test_folds = y_train[test_idx]

    ...
하지만 위처럼 입력으로 들어온 데이터가 자동차, 자전거, 오토바이중에 어떤 것인지 판별하는 Multi-class Classification 문제라면 상관 없지만 Multi-label Classification 문제라면 위 방법으로 데이터셋을 나눌 수 없다.
Multi-label Classification
- [kaggle] Plant Pathology 2021 competition - multi-label classficiation 문제
multi-label classification 문제는 위의 상황을 예로 들자면 입력으로 들어온 데이터가 사진으로 가정하고 사진 속에 '자동차, 자전거, 오토바이'중에 어떤 것들이 있는지 판별하는 문제로 생각하면 된다. 예를 들어, 샘플 데이터(사진)에 자동차와 오토바이가 등장했다면 해당 데이터의 gt(ground truth)값은 '자동차, 오토바이'로 multi label이 된다. 그래서 모델 학습을 위해 '자동차, 오토바이'가 존재하는 데이터를 해당 label이 존재하면 1, 없으면 0으로 표현하여 [1, 0, 1]처럼 변환하여 사용한다.
아쉽게도 scikit-learn에서는 이러한 muilti-label 데이터를 일정한 비율로 나눠주는 strarification 함수를 제공하고 있지 않다. 그렇다고 랜덤으로 추출해서 학습/검증 데이터셋을 나누다보면 overfitting에 빠지는 문제가 발생할 수 있다. 그래서 해결책을 찾아보던 중 이 문제를 해결해주는 라이브러리가 있어서 이를 소개하고자 한다.
github.com/trent-b/iterative-stratification
trent-b/iterative-stratification
scikit-learn cross validators for iterative stratification of multilabel data - trent-b/iterative-stratification
github.com
MultilabelStratifiedKFold
친절하게도 iterative-stratification 프로젝트에서 'MultilabelStratifiedKFold'를 사용하면 multi-label을 갖는 데이터들의 비율을 일정하게 나눌 수 있어 학습이 가능하다! 사용 방법도 scikit-learn에서 제공하는 StratifiedKFold 함수와 같은 방식으로 사용하면 된다.
기본 예제
from iterstrat.ml_stratifiers import MultilabelStratifiedKFold
import numpy as np

X = np.array([[1,2], [3,4], [1,2], [3,4], [1,2], [3,4], [1,2], [3,4]])
y = np.array([[0,0], [0,0], [0,1], [0,1], [1,1], [1,1], [1,0], [1,0]])

mskf = MultilabelStratifiedKFold(n_splits=2, shuffle=True, random_state=0)

for train_index, test_index in mskf.split(X, y):
   print("TRAIN:", train_index, "TEST:", test_index)
   X_train, X_test = X[train_index], X[test_index]
   y_train, y_test = y[train_index], y[test_index]
Output
TRAIN: [0 3 4 6] TEST: [1 2 5 7]
TRAIN: [1 2 5 7] TEST: [0 3 4 6]
kaggle 에서 진행하고 있는 plant-pathology-2021 competition의 데이터를 가지고 예시 코드를 돌려보았다. (자세한 결과 정보는 아래 kaggle notebook을 확인하면 좋습니다.)
www.kaggle.com/ljh0128/multi-label-data-split-method
Multi-label data split method
Explore and run machine learning code with Kaggle Notebooks | Using data from Plant Pathology 2021 - FGVC8
www.kaggle.com
>>> df.head()
	image			healthy	scab frog_eye_leaf_spot	complex	rust	powdery_mildew
0	800113bb65efe69e.jpg	1	0	0		0	0		0
1	8002cb321f8bfcdf.jpg	0	1	1		1	0		0
2	80070f7fb5e2ccaa.jpg	0	1	0		0	0		0
3	80077517781fb94f.jpg	0	1	0		0	0		0
4	800cbf0ff87721f8.jpg	0	0	0		1	0		0
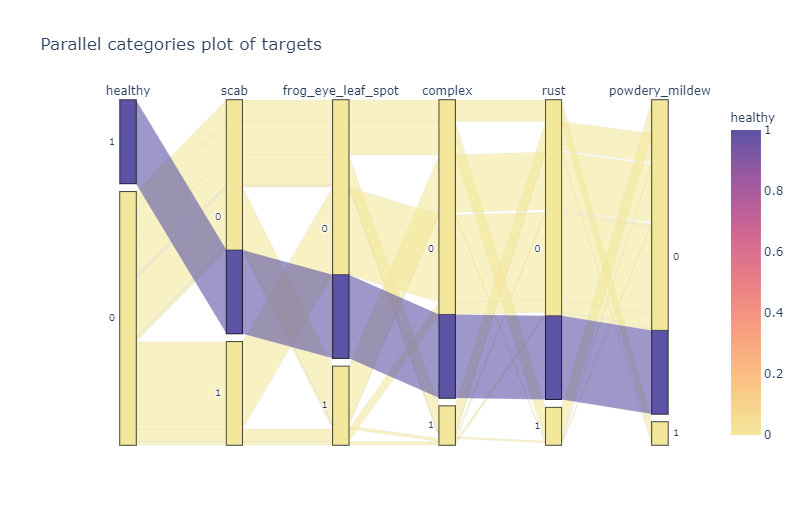
해당 대회에서 제공하고 있는 데이터는 ['healthy', 'scab', 'frog_eye_leaf_spot', 'complex', 'rust', 'powdery_mildew'] 라는 6개의 label을 갖는 muilti-label dataset이다.
>>> import plotly.express as px
>>> fig = px.parallel_categories(
	df[["healthy", "scab", "frog_eye_leaf_spot", "complex","rust","powdery_mildew"]],
    	color="healthy",
    	color_continuous_scale="sunset",
    	title="Parallel categories plot of targets"
    	)
>>> fig.show()
이를 plotly 라이브러리를 이용해 시각화하면 아래처럼 데이터의 분포를 파악할 수 있다. 간략하게 그림을 설명하자면 각 label별로 1, 0을 갖는 데이터의 분포를 막대로 표현하였고 파란색 연결선 처럼 ['healthy', 'scab', 'frog_eye_leaf_spot', 'complex', 'rust', 'powdery_mildew'] = [1, 0, 0, 0, 0, 0]인 데이터의 개수가 많을 수록 두껍게 표현하였다.

이제 이 데이터셋을 MultiStratifiedKFold 함수를 이용하여 나눠보고 plotly를 이용해 시각화해보자.
pip install iterative-stratificationX,Y = df['image'].to_numpy(), df[["healthy", "scab", "frog_eye_leaf_spot", "complex","rust","powdery_mildew"]].to_numpy(dtype=np.float32)
from iterstrat.ml_stratifiers import MultilabelStratifiedKFold
msss = MultilabelStratifiedKFold(n_splits=5, shuffle=True, random_state=1234)
for train_index, test_index in msss.split(X, Y):
print("TRAIN:", train_index, "TEST:", test_index)
X_train, X_test = X[train_index], X[test_index]
y_train, y_test = Y[train_index], Y[test_index]
kfold_train_df = pd.DataFrame(columns=["healthy", "scab", "frog_eye_leaf_spot", "complex","rust","powdery_mildew"], data=y_train)
kfold_test_df = pd.DataFrame(columns=["healthy", "scab", "frog_eye_leaf_spot", "complex","rust","powdery_mildew"], data=y_test)
fig_train = px.parallel_categories(kfold_train_df[["healthy", "scab", "frog_eye_leaf_spot", "complex","rust","powdery_mildew"]], color="healthy", color_continuous_scale="sunset",\
title="categories plot of y_train")
fig_test = px.parallel_categories(kfold_test_df[["healthy", "scab", "frog_eye_leaf_spot", "complex","rust","powdery_mildew"]], color="healthy", color_continuous_scale="sunset",\
title="categories plot of y_test")
fig_train.show()
fig_test.show()
break

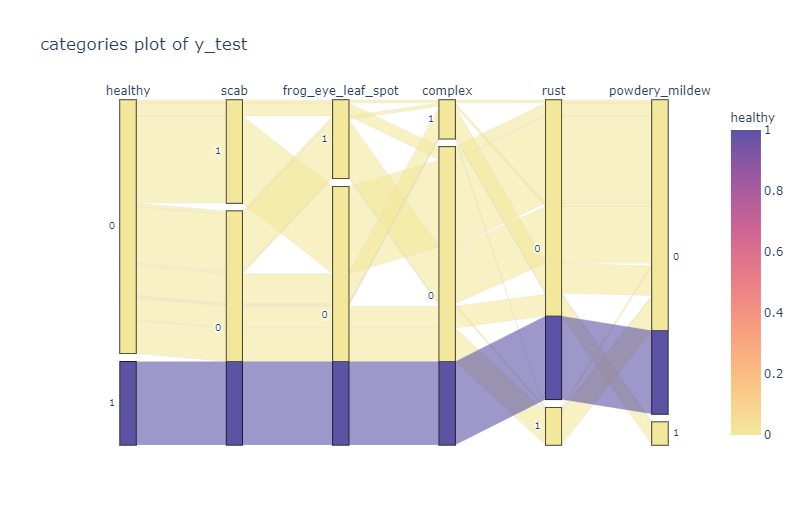
MultilabelStratifiedKFold를 이용해서 나누어진 데이터셋을 보게되면 train data와 test data의 분포가 비슷한 것을 확인할 수 있다. 즉, 원본 데이터셋의 multi-label의 비율에 맞게 잘 나누어 주었다.
따라서, Multi-label Classification 문제를 풀고자 할 때 데이터셋을 비율에 맞게 나누고 싶다면 iterative-stratification 라이브러리를 이용하자!
'Deep Learning > Pytorch' 카테고리의 다른 글
| BCEWithLogitsLoss 와 MultiLabelSoftMarginLoss 차이 (4) | 2021.04.27 |
|---|---|
| num_workers & pin_memory in DataLoader (0) | 2021.04.18 |
| [개발팁] Multi-label Classification에 쓸만한 전처리 모듈 'MultiLabelBinarizer' (0) | 2021.04.18 |
| [개발팁] torch.nn 과 torch.nn.functional 어느 것을 써야 하나? (0) | 2020.08.07 |
| [Label Smoothing] 요약 정리 (0) | 2020.07.28 |